Archive for the ‘News’ Category
Determining a vacant lot value
 When determining the value of a lot there are numerous issues that need to be addressed including ensuring the lot appraised is the correct property. This can be an issue when the lot is landlocked and does not have access to the street. This is especially true when the lot is being subdivided and not in a typical new development subdivision. Other issues may include, unknown easements that could not be discovered during the course of a simple inspection, the “buildability” of the lot and the “highest and best use”.
Assuming the “highest and best” use is a single family home building lot and the lot is “buildable”. Meaning there is access, the city zoning will allow the building, the soil will allow for a building lot, there are no easements, etc. There are 3 methods to determine a site value. They are 1- The Sales comparison method, 2- Allocation method and 3- The extraction method.
The Sales Method
The sales comparison method is the most common and in most cases the most reliable. This is similar to completing an appraisal on a single family home. The appraiser looks at the features that a home has and compares them to other similar homes. The biggest difference is that lots do not have as many features as homes. Another issue that may be common with infill lots is there are limited similar sales.
Using paired sales to determine price per square foot is one way to determine the price per square foot. For example, I am looking at a subdivision in which there are 2 lots that are very similar in all respects but size. One property is 13,503 square feet. This property sold for $250,000. A second lot is 18,295 and sold for $272,000 all things being equal the value of the additional 4,792 (.11 acres) is worth $22,000 or $4.59 per foot. This method is effective where there are smaller differences between lots with in similar or the same subdivision. However, this would not be effective when looking at much larger or much smaller properties. Much larger lots may represent a surplus of land or an excess of land (could be subdivided). Whereas, much smaller lots would not have the same utility for example the neighborhood may have large homes which require a much larger lot and the lot in question may be large enough to build a home but not a home similar to other homes in the neighborhood.
The Allocation Method
This method is effective when looking for comparable lot sales in an area with new construction. The idea is the lot value represents some percent of the total cost of the sale. For example, if a new construction home sold for $600,000 and the cost to build can be determined to be $400,000 based on a conversation with the builder or some other method it can be surmised that the value of the lot is $200,000 or 33% attributed to the land. If houses near the subject have recently sold near the subject for $560,000 to $650,000 it can assumed that the lot values range between $185,000 and $214,500.
This method is not effective in areas with older home sales because the depreciation of the home is subjective and difficult to determine.
The Extraction Method
This Method is the most complicated and requires the most work. In brief, the site value is the difference between the sale price and the value of the contributory value of the improvements. This method is similar to the allocation method in that it requires the cost of all lot improvements with the additional component of the accrued depreciation. The end result is not a percent of the total value as in the Allocation method, but rather, a site value on each property. For example:
| Address | 123 Abc St | 321 Abc St |
| Date of sale | 01/31/2019 | 02/01/2019 |
| Sale price (SP) | $250,000 | $285,000 |
| Replacement cost new | $175,000 | $200,000 |
| Depreciation of improvements | $48,500 | $75,000 |
| Depreciated value of improvements (DVofI) | $126,500 | $125,000 |
| Site value (SP – DvofI) | $123,500 | $160,000 |
| Site size | 10,000 sf | 12,000 sf |
| Site value per square foot | $12.35 | $13.33 |
The method that is most reliable is the sales approach, however, is some circumstances one of the other two methods may be employed to determine the value of a lot.
READ MORE
When is the best time to sell?
Recently I purchased a home as an investment with the intention of remodeling the house and then selling it. I purchased it in early November and after thinking about it, I realized that for the past 3 years the market has increased significantly around May to July. I remember talking to fellow appraisers about purchases in May with 5 to 10 offers some as high as 10 to 15% higher than then the listing price. It got me thinking, would it be better to wait to sell the house until May. Most of the time when you purchase a house to flip the goal is to sell it as quickly as possible. Especially in this uncertain market when rates could move up and the stock market moving average looks like the Swiss Alps. I talked to my friend Thomas Young. After looking at the past 20 years we found some interesting information that you may also appreciate.
We first looked at the average sales price in Utah and this is what we came up with.
The following figure is the gain or decline in price by month. On average, May is the best time to sell a home. The spring and early summer months have seen the strongest month-over-month appreciation, on average (March, April, May, June). The worst month in September. The winter months (December and January) are also generally the weakest market appreciation.

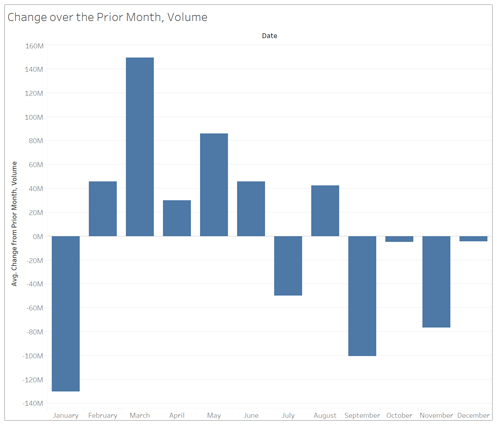
This is the same chart as the previous one, replacing home price with volume. Similar to the previous chart’s finding, March through June are the best months for finding a buyer. September to January are the worst.
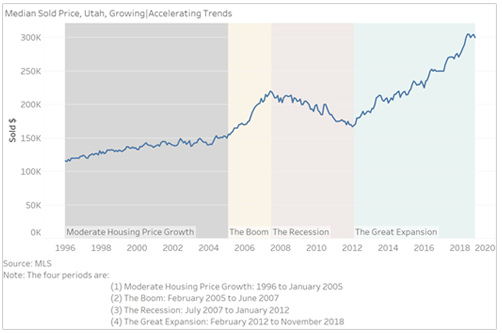
This background is all fine and good, but what if we’re heading for a recession? Would it still be better to wait to sell? Does the timing matter? To answer this, this chart breaks down housing prices into four economic periods.
The first is the “Moderate Housing Price Growth” period, from 1996 to January 2005. Over this period, the median home price grew from $116,000 to $149,900. That’s $33,900 over 9 years or 72 months. An owner (of a median home) made $491 each month. Not bad.
Switch to “The Boom” – in yellow. From the starting point of $149,900 in January 2005, home prices grew by $70,100 over 28 months through June 2007. That’s a massive monthly increase of $2,504 per month. A very healthy return.
The run-up unsurprisingly ended with a thud, and then some. The period labeled “The Recession” (in pink for the blood it shed), saw houses lose value quickly. From the June 2007 peak to the January 2012 bottom, home prices dropped by $53,000. That’s homeowners losing $954 every month for 4 ½ years. Uncomfortable.
Lastly, shifting to the last of the four periods “The Great Expansion” – in green. From the $167,000 low, the median home price is up to $300,000. In one month, that will be 7 years. Owners (and investors, of course) have increased their wealth by $133,000. A nice return. That’s $1,602 each month. Healthy, and much stronger than the $491 per month owners made from 1996 to 2005.
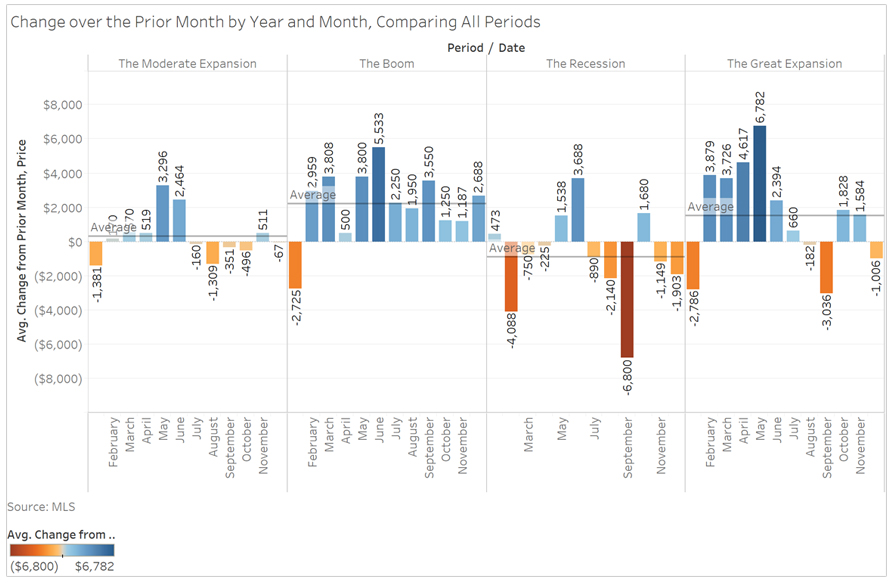
With this background in mind, does it still hold that the spring/summer months are best to sell? What if we see a recession start in January 2019? Would it be better to sell now or wait until May 2019?
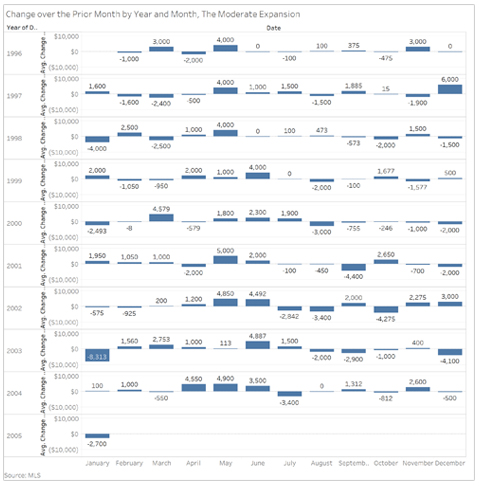
Here’s a look at the four periods. The first, here, is the “Moderate Expansion” period. The moderate expansion period was fairly healthy. May and June were the best months, with the September to January period being generally the worst.
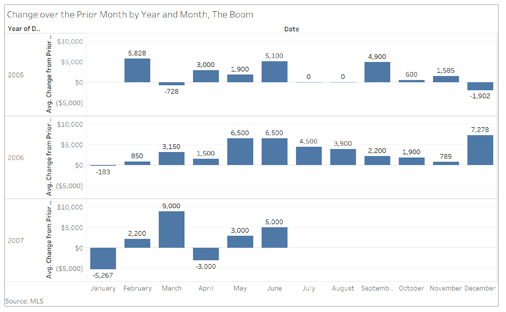
The second period, the “Boom” period, saw much healthier figures. May and June were again the best months generally, but we only saw a few months of negative price change, two of which were January. The same general cycle holds, with stronger spring/summer months. Interestingly, and I think you alluded to this, the September through January months still saw positive price growth, just lower in magnitude. That seems to be a signal of a booming housing market.
I am text block. Click edit button to change this text. Lorem ipsum dolor sit amet, consectetur adipiscing elit. Ut elit tellus, luctus nec ullamcorper mattis, pulvinar dapibus leo.
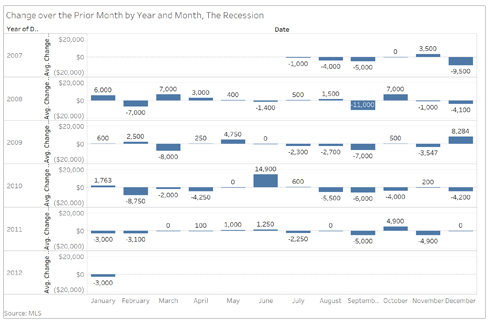
Shifting to the third period, “The Recession”. The recession period was more choppy. The biggest changes occurred in the September to February period. Interestingly, there were still some positive increases in the spring/summer months.
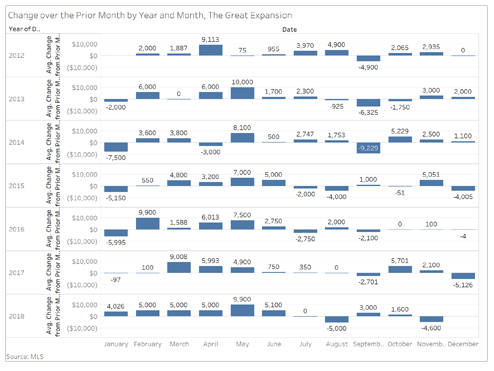
Lastly to the Great Expansion. Again, March through June are the best months. The September through January months doesn’t appear to be as weak.
Here’s a look at all 4 periods on one graphic. The current period – “The Great Expansion” – is not as strong as The Boom, but stronger than The Moderate Expansion. Somewhat surprisingly, even during the recession period, May and June still saw average price increases. Although, if you back out January through March declines, a home that could be sold today and instead it was held through June would only be up $616 over six months. On the face of it is a very weak return, however, when one considers other options including a suddenly declining stock market, holding cash in real estate until spring may be the best option available.